Results
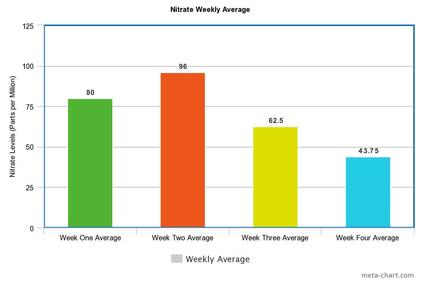
Figure 1 shows the weekly average of nitrate levels.
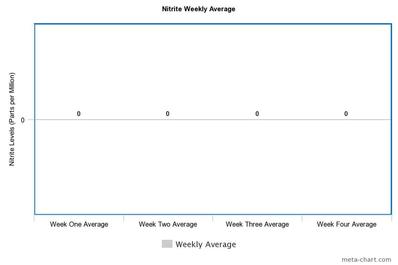
Figure 3 shows the weekly average of Nitrite levels.
|
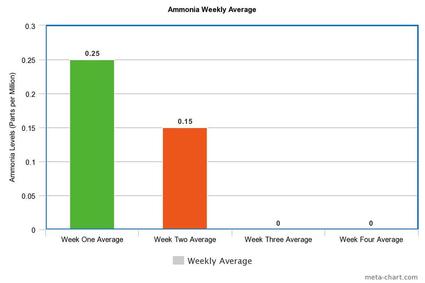
Figure 2 shows the weekly average of Ammonia levels.
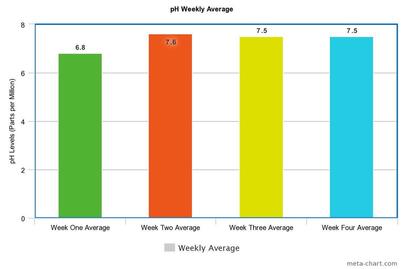
Figure 4 shows the weekly average of pH levels.
|
Discussion
Quantities such as 0 ppm (for Ammonia,nitrite, and nitrate) and 6 (for pH), indicate a healthy aquarium, while 8.8 (pH), 8.0 (ammonia), 5.0 (nitrite) and 160 (nitrate) are threatening to the fish. Our data supports our initial hypothesis because as seen on figure 1, after the live plants were placed in the tank, the average nitrate levels diminished from 90 and 80 to almost half of the initial levels during week 3 and 4. As for nitrite, pH and ammonia, figures 2,3 and 4 show that overall they were very consistent and stayed within the healthy range. There was a slight change on the nitrite which went from 0.25 to 0. These were the results we found, however, some confounding variables that we didn't have control over were the birth of the fish (many of our fish got pregnant and gave birth throughout the process) and H2O change frequency; since more fish were born, we decided to do a more frequent water change due to the fact that there was going to be more feces.
Next Steps
There were variables that we didn't have control over such as the birth of the fish and water change frequency; therefore, our next steps would be repeating the experiment but keeping the amount of fish constant which would lead to a more consistent water change frequency. Another element we would like to measure is the dissolved oxygen and carbon dioxide levels; this is because we would like to know if adding real plants to the tank adds additional oxygen, and in turn create a lower CO2 level.
